Here you find mostly the description of the
earthquakes that were recorded during the year 2021.
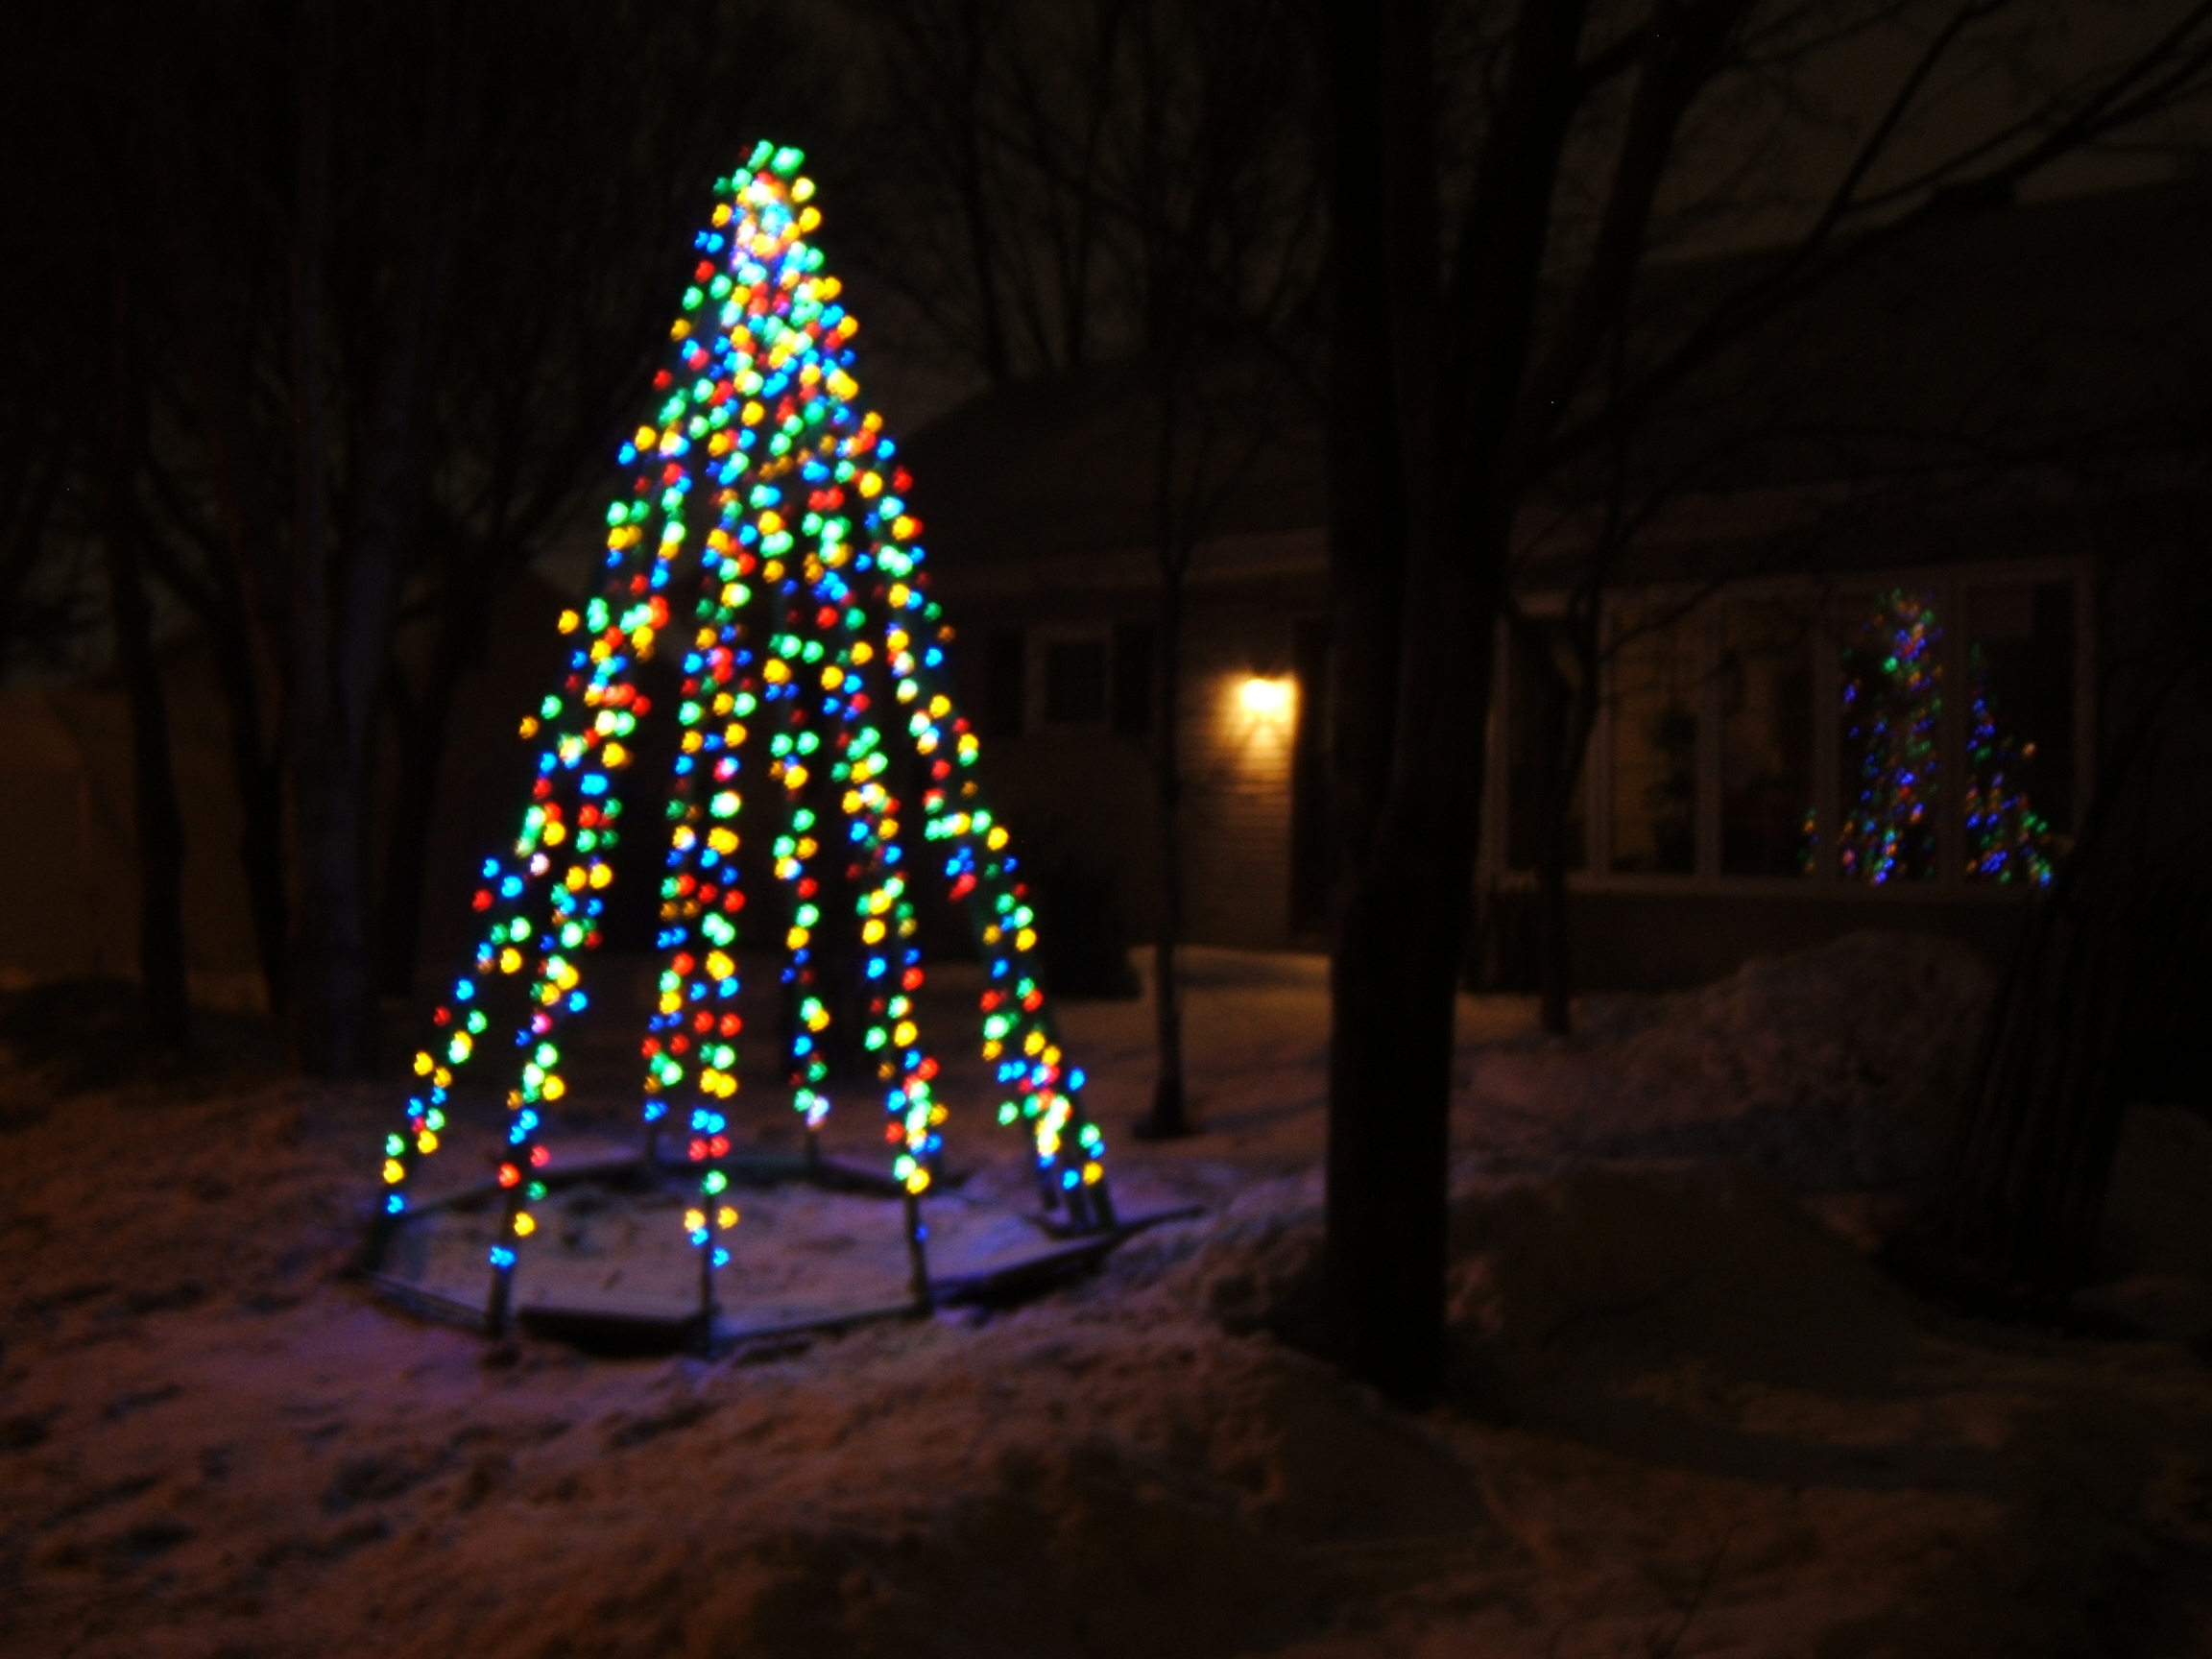
In december, I posted a message including a picture of "the tree" to the more than two hundred thousand fans who follow this page. Again, I would like to thank you. Without you, this page would could not exist.
When I was asked to describe how I built "the tree", I chose to reproduce my message here. Who knows. this information could be useful to build the next year's tree. It should be very similar to this one...
Je suis allé au Reno-Depot. J'ai acheté des planches de trois pouces de large par douze pieds de long. J'ai acheté vingt planches mais j'en ai utilisé que quinze ou seize. J'ai vérifié sur internet. Il faut un angle de 21 +/- 4 degrés. (Un étudiant a fait une étude à partir des images sur Google!) J'ai donc utilisé 20 degrés. Ça donne 12 planches de 12 pieds chacune espacée de deux pieds à la base. J'ai ensuite attaché mes planches en forme de triangle: (12 pieds, 12 pieds, 24 pouces) Six triangles séparés que je peux facilement transporter dans le sous-sol. Absolument nécessaire! Au sommet toutes les planches ont une petite plaque de tôle pour pouvoir passer une broche au travers pour les attacher ensemble. J'avais pensé seulement percer un trou, mais le bois va se fendre. J'ai donc mis une tôle de trois pouces par six pouces repliée avec deux boulons (10-24) qui passe au travers les trois épaisseurs. Ensuite il y a un trou (1/4 pouce de diamètre) pour passer le fil de fer. En bas c'est simplement des trous de 5/16 pour attacher les planches ensemble avec de la corde (ou de la broche).
Au magasin Dollarama, ils vendent des guirlandes de LEDs pour les enfants. La guirlande consiste en 40 LED attachées en parallèle au bout d'un petit boîtier en plastique qui contient deux piles AA C'est pour les enfants. J'ai vérifié. Les 40 LEDs sont en parallèle et sont alimentées à trois volt (3.0 VDC) par les deux batteries. Il n'y a AUCUNE résistance en série. Le courant de chaque LED est de 3.12 mA pour un grand total de 120 mA à 3 volt exactement. Puisqu'il n'y a pas de résistance en série, il faudra donc faire attention à l'alimentation. J'ai donc choisi de mettre quatre guirlandes en série, pour un total de 12 V, 125 mA pour chaque triangle. Il y a six triangles pour un grand total de 12 V avec un grand total d'un peu moins de 1 A. J'utilise donc un petit adaptateur AC (en switching) qui vient du marché aux puces. 12V 1.5A. C'est pas fait pour l'extérieur, mais je l'ai enveloppé dans un sac de plastique. Pour un mois ce sera suffisant.
J'assemble les triangles individuellement au sous-sol. Les trois planches sont attachées par de la broche. Le point critique est au sommet, au moment de l'assemblage. Je reviendrai sur ce sujet. Chaque triangle a deux grandes planches qui font quatre surfaces ce qui convient pour mes quatre guirlandes en série. J'ai donc attaché tout cela avec du ruban d'emballage transparent. La guirlande a des LEDs espacées de six pouces sur une longueur de 15 pieds. On finit donc par obtenir un LED a tous les quatre pouces de chaque côté des planches. Ça prend en tout deux rondelles de ruban d'emballage. Je coupe et je jette les petits boîtiers de plastique et je soude les quatre guirlandes en série. C'est assez facile, puisque nous sommes dans le sous-sol et les soudures sur les LEDs sont bien faites. Ca prendrait une semaine pour souder les 960 LEDS mais heureusement elles sont bien soudées! Même l'agencement des couleurs est constant. Ils doivent avoir une machine! Le fil électrique des guirlandes est par contre très petit mais le plastique autour est assez résistant. Ensuite on peut facilement transporter les six triangles à l'extérieur et les brancher en parallèle. C'est ça la partie difficile! Très difficile puisqu'on est à l'extérieur! Je n'avais pas de connecteurs adéquats et j'ai donc décidé d'emmener mon fer à souder à l'extérieur! Oh lala.... Je me les suis gelés. Le fer a souder reussi a peine a faire la soudure. Qui aurait dit qu'on ne peut pas utiliser un fer à souder à l'extérieur l'hiver. L'an prochain je dois absolument trouver des connecteurs.
Pour ériger la structure, j'étends les six triangles à plat sur le sol et j'attache les six triangles avec le fil de fer. Puis je tire le millieux vers le haut Ca fonctionne très bien. Pas besoin d'une échelle... A condition d'avoir de la flexibilité au niveau du point d'attache en haut, d'où l'intérêt d'avoir une petite plaque de métal beaucoup plus mince que la planche. Il ne manque plus que de relier les six triangles par six planches de 24 pouces au niveau du sol. J'ai percé les planches avec deux trous à chaque bout, j'ai mis une corde avec laquelle je fais le tour de la planche verticale. Étrangement, un coup assemblé, la structure est très solide.
La partie difficile a vraiment été de brancher les six triangles en parallèle sur le bloc d'alimentation. Ça doit nécessairement être fait à l'extérieur. Et il fait froid! J'avais pensé à faire ce projet depuis un an. J'en avais marre de poser des lumières autour de la maison dans la neige a chaque hiver. Je voulais une structure démontable. Par contre je n'avais jamais trouvé de lumières LED a un prix abordable. J'ai quand même travaillé la dessus pendant deux semaines (à temps partiel). Dans la première version, j'avais seulement fait un trou dans les planches au bout en haut et je n'avais pas fait de triangles. Ça ne marchait pas du tout. Au sommet la circonférence aura au moins 24 pouces et la structure ne sera pas stable. En plus si tu fais une fausse manœuvre au moment de l'installation, les planches vont se fendre. Une petite plaque de tôle qui fait le tour de la planche avec un trou pour passer le fil de fer est une bonne solution. Il faut aussi que je mentionne que d'ériger un tee-pee avec douze planches attachées au bout à partir du sol est pratiquement impossible. Il y'en a toujours une qui se plante dans le sol au mauvais endroit! Par contre, ériger six triangles est plus facile. Très facile en fait. J'ai utilisé mon bac à ordures (vide) comme table pour tenir les triangles et je n'avais même pas à me pencher au moment de passer le fil de fer dans les trous. En tout j'ai finalement fait trois essais sur une période d'un mois! Je suis finalement assez content du résultat. J'avais failli abandonner.! Coût total: $200 Voila! Joyeuses fetes a tous.
The time for this one was 2021-12-21 22:42:14 UTC. The grid locator is: BP30JD. the distance to our station is 5250 km.

The exact event time was 20:10:18 UTC and we observe five a five minutes burst at 20:30 UTC. The grid locator is: CN70OH. This is 4292 km from our station.

The figure bellow shows the minute-by-minute spectrogram for the 20 hour UTC. Please note the higher 0.17 Hz frequency signal component first followed by the lower 0.09 Hz component four minutes later.

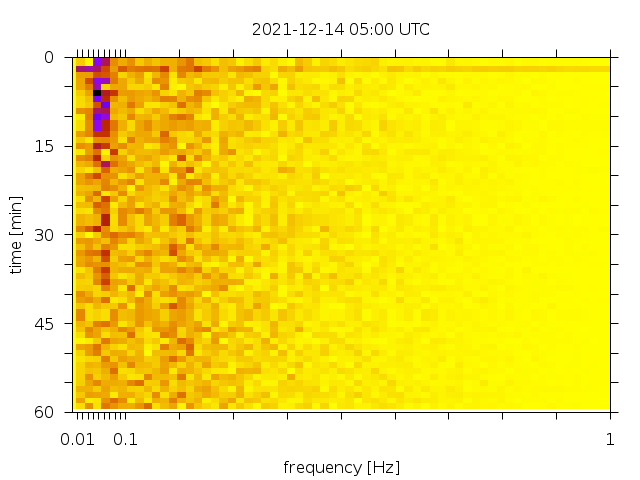
Two weeks later, we receive a long signal from Indonesia. More precisely it was located on a small island just north of Australia, half way to Jakarta (PI13CI). The distance to our station is 15388 km. The magnitude was Mww7.3 and precise date-time of the seism was 2021-12-14 03:20:24 UTC. Its location was 7.6033° S, 122.2° E. The following plot show the hourly spectrograms here in Quebec city. The earthquake signal laps over three lines for a total duration of two hours! Truly amazing. The fastest signal component takes fifteen minutes to reach our location while the surface kiks in an hour later.

Follows the minute by minute spectrogram for the 03h, 04h, and 05h (UTC) lines. Please note the strong "high frequency" component of approximately 0.12 Hz at 03h45, then a "low frequency" signal of 0.05 Hz at the end of hour 04 that extends into the beginning of hour 05. Lower frequencies are characteristic of surface waves.


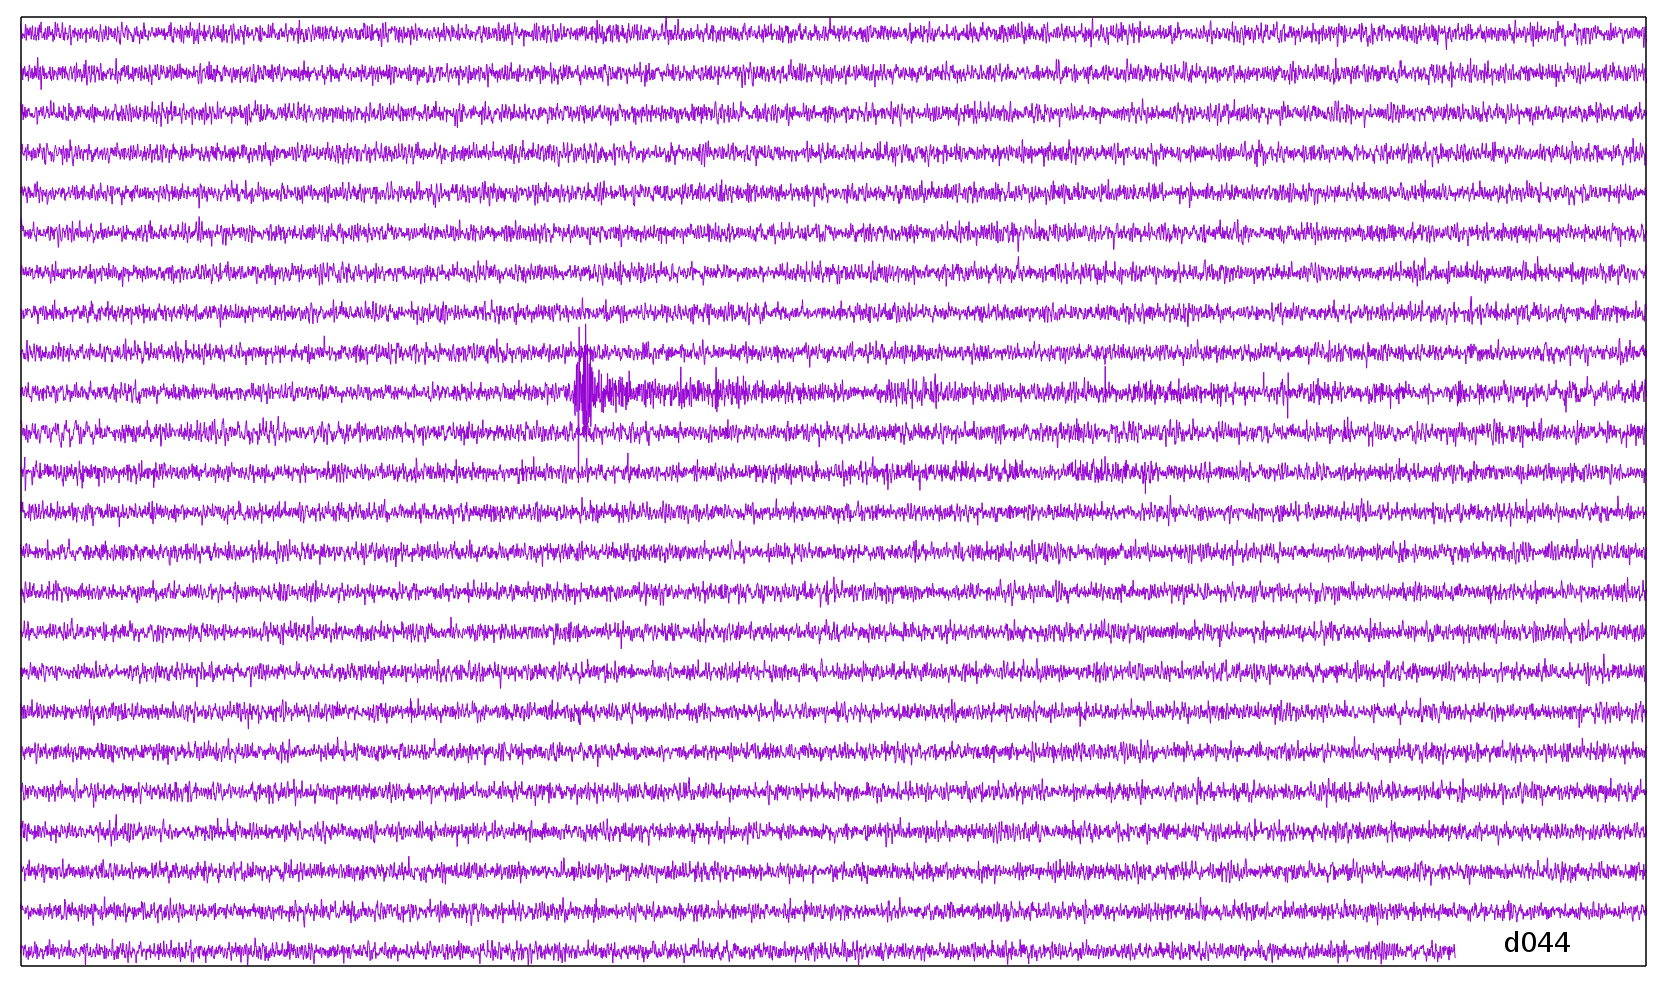
The following graph covers a period of twenty two hours during Nov. 28th, 2021. At around 11h00 UTC a strong wave reached our detector. USGS WILBER localized the signal from Peru (FI15PM)(This would be 5730 km from our station). Luckily the signal was not contaminated by any other source. Please note the recording interruption towards the end of the day. It was not possible to precisely determine its cause, but it was probably due to an unreliable UPS, batteries or defective software. Also we mention that for the entire day the trace is more noisy than usual. This corresponds to a cloudy day with about ten centimeters of snow, the first snow fall of the winter in Quebec city.

The next figure is the waterfall spectrogram for roughly the same period. It shows the power spectral density (false color) as a function of the frequency (horizontal axis) from 0.016 Hz to 1 Hz (128 FFT bins). One line (spectrum) is plotted every minute over a period of about one day (vertical axis).
We observe a strong component (black dot) at 0.51 Hz in the lower part of the graph which corresponds to the strong "P" component. Later the plot is dark at around 0.2 Hz and this may correspond to the surface waves.
Finally we show the expanded seismogram. The time span is thirty minutes. The propagation structure components TOA were adapted from the WILBER model. We used the numbers for the GAC station. The correspondence between the lines is however not very good.
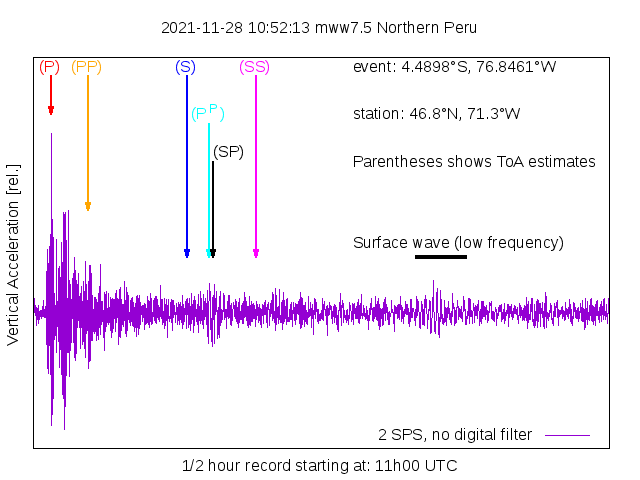
The position of the earthquake can be seen at EK61VF on the grid locator. The distance from our station (FN46IS) is 4198 km. This is plotted over a thirty minutes range and clearly shows the lower frequency oscillations during the surface wave phase. Unfortunately the location of the bulk waves arrivals is not very well defined.
This is small signal, however the principal wave component very visible. The position of other wave components is also shown for information only.

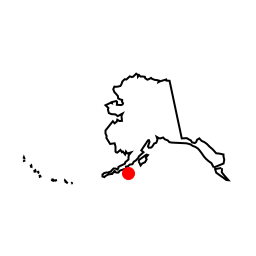
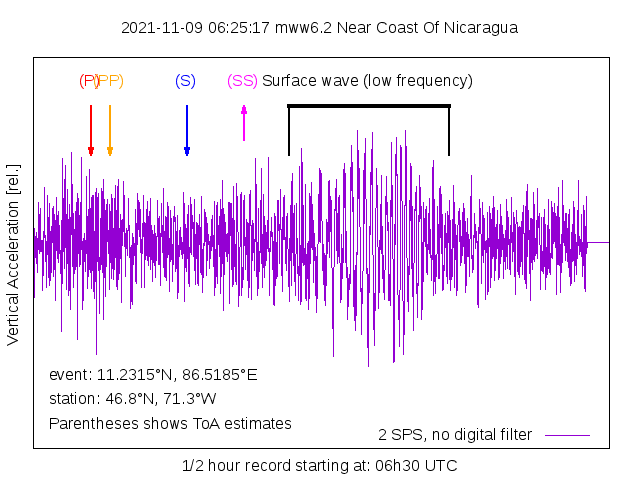
This is the first earthquake monitored from the Alaskan region.
The large amplitude and moderate distance allows us to observe
more details. The arrows identified by parentheses represent the
estimated time of arrival for different propagation modes. We
think that the time coincidence and signal quality are sufficient
to identify the first two or three peaks. Please note the
background noise envelope before the first peak and later as the
signal envelope slowly decays. This shows a rather slow
dissipation of the seismic energy.

This waveform is a short segment from the larger daily plot
shown below.

This is the weakest earthquake that I could detect.

This record is a magnitude 6.5 earthquake in Nicaragua. A close look shows that the first component (bulk waves) has a higher frequency content than the second component (surface waves).

 |
 |
A close look on the seismograms presented earlier shows a small
dead zone in some parts of the plot. This straight line can be
interpreted as a time marker to indicate the start of the hour.
Here is an explanation.
The instrument is equipped with an analog to digital converter
which is connected to a personal computer thru a USB port. The
averaging time of the converter is 0.4 second. The computer
program runs inside a loop, periodically asking for time, waiting
and then reads a number. The readings are fetched at a rate of two
samples per second. The samples are converted to floating numbers,
scaled and saved to the disk. Every file contains 7200 numbers to
cover a one hour period.
The acquisition program does not run for an infinite amount of
time. Instead it is started by the computer's job scheduler at the
beginning of the hour and stops after one hour. There is no
justification for doing this way except than saying this is still
under development, it was easy to program as opposed to a more
complex background software and finally this approach guarantees a
short down time and a fresh start in case there is a
software/computer crash. The down side to this method is we should
prevent a new job to start while the previous one has not
terminated. I wanted to avoid this dangerous situation!
Instead I run the program for a period slightly shorter than one
hour, leaving some time for the computer to terminate the
remaining conversions, close the files properly and dwell until a
new job is called. Again, this is under development and should be
improved.
The samples are stored in ASCII in the file with one number per
line. for example line number 1220 represent 10 minute and 10
second after the start of recording. The file name represent the
start time. It is easy to get a longer record by merging two or
more files together. It is then necessary to complete the
remaining of each file with dummy lines to get exactly 7200 lines.
Because this padding occurs at the end of the hour, it is easy to
write the average of the previous numbers. This is done in real
time by the acquisition program.
The whole shebang described above makes it possible/easy to
directly manipulate and plot the raw data without any further
software treatment!
There is no digital filtering applied to the samples. The analog
signal is (properly, Nyquist) filtered before conversion. This was
chosen with the objective that the raw signal is limited to
frequencies lower than one Hertz.

This one occurred in Acapulco, Mexico, but is labelled "Near
Coast of Guerrero." I always use the same exact label supplied by
USGS WILBER to describe the events. That includes location
and time. Please see this Wikipedia page for a longer
description of the disaster.


Here is the
2021 disaster. It was located at 6 km from the town of
l'Asile in Haiti. Sadly this is the deadliest
earthquake this year with thousands casualties: Wikipedia


[2022-06-06 Update:] Sadly, this earthquake came from the same site as the one that caused lot of damage to the fukushima nuclear power station ten years ago. We also recorded, more activity from this site: ["2022-03-16"]