
Here you find mostly the description of the
earthquakes that were recorded during the year 2022.
This year's Christmas Tree has blossomed. In addition to the last year's miniature LEDs we added two hundred fullsize, incandescent light bulbs, producing a gorgeous effect, at the expanse of 1050 Watt as opposed to 50 Watt earlier.
COORD: 40.525°N, 124.423°W, 2022-12-20 10:34:24 UTC, 17.91 km, mw6.4 Near Coast Of Northern Calif.

COORD: 15.3983°S, 172.968°W, 2022-12-04 19:24:15 UTC, 35.999 km, Mww6.7, Samoa Islands Region
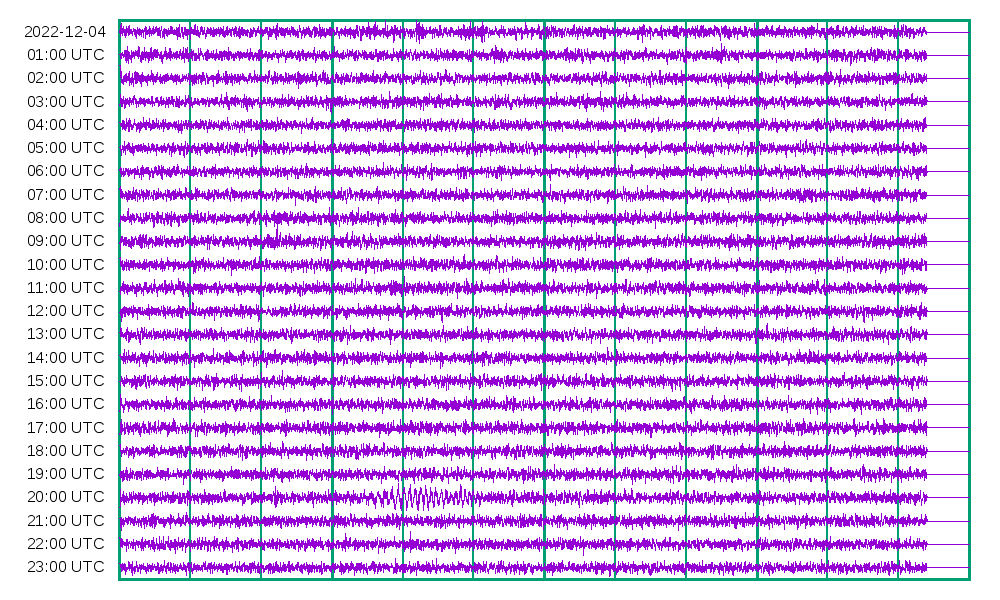
COORD: 56.137°N, 116.5646°W, 2022-11-30 00:55:56 UTC, 10.0 km, mww5.3, Alberta, Canada


We observe several surface wave components:
At 03:05 UTC: 9.8114°S, 159.5871°E, 2022-11-22 02:03:07 UTC, 14.0 km, Mww7.0, Solomon Islands
At 03:30 UTC: 9.8901°S, 159.4816°E, 2022-11-22 02:37:57 UTC, 10.0 km, Mww6.0, Solomon Islands
At 17:00 UTC: 30.7832°N, 116.3899°W, 2022-11-22 16:39:05 UTC, 10.0 km, Mww6.2, Baja California, Mexico
COORD: 4.8915°S, 100.8032°E, 2022-11-18 13:37:08 UTC, 25.0 km, mww6.9, Southwest Of Sumatra, Indonesia

Please note that the time marker on this graph is offest by exactely one hour. The travel time should be approximately one hour. The problem has been fixed.
COORD: 31.618347°N, 103.968169°W, 2022-11-16 21:40:29 UTC, 5.604553 km, ML3.2 Western Texas

This was a very small earthquake captured from a moderately long distance. The travel time of all wave components ia between 5 and 10 minutes.
COORD: 19.3181°S, 172.1001°W, 2022-11-11 10:48:45 UTC, 24.797 km, Mww7.3, Tonga Islands Region

This earthquake was located in the same region as the underwater volcano on January 15th. It triggered a tsunami warning but fortunately, only small waves were repored.
COORD: 75.7552°N, 105.0994°W, 2022-11-04 21:31:20 UTC, Depth: 10.0 km, mww6.1, Gulf Of California.
COORD: 75.7552°N, 105.0994°W, 2022-11-04 21:31:20 UTC, Depth: 10.0 km, mb4.8 Queen Elizabeth Islands, Canada.

I participated to the phone weekly amateur radio contest. I made only only one contact during the thirty minutes of the contest!
Last weekend, I participated to the 2022-CQ-WW-SSB contest. A Ham (amateur) Radio contest consist in doing as many QSO in a given period. The 40 m (meter) band was crowded with "CQ CONTEST" calls therefore I jumped! For my first participation, few things were far from perfect. For example I worked very late non-stop on the first night, as a result, I was exhausted on sunday. The 48 hour format of the contest is very demanding.
Also, not being familiar with the logging procedure, each QSO would take me as long as 15-30 minutes to record. I made several mistakes that took me like forever to correct. I would not want to penalize my contacts with incorrect postings. Also I need to get a better logging software and learn how it works! In the end I edited the cabrillo (log) file myself.
I participated in the SINGLE-BAND (40 m), LOW-POWER (100 W), ROOKIE (less than 3 Y) category.I made 46 contacts (4 duplicates) in 19 countries. That was fun!
Today I had my first two QSOs. A QSO in amateur radio parlance is a contact that you do over the air. The hobby is filled with codes and loaded languages. In this blog, I keep the same tone of voice so that you taste the flavor.
First, someone from my club answered my "CQ CQ CQ". Well I guess it sounded desperate... Anyhow, there he is: someone from my own club! Hard to miss him, he has the highest antenna in town and he lives one block away from me. I sure will remember my QSO No. 000 for a long time.
A few minutes later, as I was cooling down from that experience, I hear on the same frequency "CQ CQ..." I jumped on the PTT switch and there we are: A real QSO this time from Ontario. From someone I could not have met otherwise. You bet I will remember that one as well.
I spent the rest of the evening yelling in the mike: "VE2KLW" but nope! So much communication for one night. Two QSOs for the first night; not bad. Steady as it goes...
UPDATE. Oct 25, 2022: After those two QSOs, I had two more. One was in Italy and the other one was in Spain. All those with one hundred watt output power. The next day I had a QSO with someone in West Virginia.

COORD: 7.6712°N, 82.3396°W, 2022-10-20 11:57:11 UTC, Depth: 10.0 km, Mww6.7.
This earthquake occurs one month after the Mexico M-6.8 quake. While the S/P wave amplitudes are slightly smaller, we observe that the surface wave amplitude is much attenuated compared to the Mexico quake. We beleive this could be due to the presence of the water (Caribbean sea) in the trajectory between the seism and our station. Most likely the ocean surface attenuates the surface wave.

COORD: 18.3081°N, 102.9226°W, 2022-09-22, 06:16:09 UTC, Depth: 24.119 km, mww6.8.
This one is an aftershock from the M-7.6 quake on the 2022-09-19 (see below). It was felt almost everywhere in the country and two people died.

COORD: 18.3667°N, 103.2524°W, 2022-09-19 18:05:06 UTC, D: 15.134 km, mww7.6
Wow! This one was the most powerfull signal we ever saw. At this time, shortly after the seism, no casualties have been reported.
[UPDATE:] Two death were were reported. Sadly, September 19th, commemorates the 1985 earthquake that killed 9500 people and one on the same day in 2017 as well.
On our graph, the longitudinal component (P) is seen at 18:12 and the transverse component (S) at 18:14. fnally the broad surface wave component extends for an hour and its tail is still visible at 19:25.
Please note that although we have no formal calibration for the amplitude, the scale is linear with no compression and we beleive there was no amplifier saturation. Also the instrument gain, its location, position, orientation and thermal environment have never been modified since it was put in operation in january 2021.
The time stamps for the readings are traceable to a GPS receiver and are accurate to a few seconds. One might say that a computer clock synchronized to the GPS system is surely accurate to a few milliseconds, but we want to be prudent at this time. Many unknown factors could be misleading here such as the amplifiers and the instrument response time, etc.

COORD: 23.1589°N, 121.316°E, 2022-09-18 06:44:14 UTC, 10.0 km deep.
This is the strongest of a series know as "2022 Taitung Earthquakes". Over a period of two days, as many as nine events from M5.1 to M6.9 were recorded. Hundreds of casualties were reported. The whole area has been put under alert for a possible Tsunami including Japan.

The signal at 14:45 to 14:51 is most likely from: 23.0962°N, 121.4059°E, 2022-09-17 13:41:17 UTC, Depth: 10.0 km. The (long) one hour propagation delay indicate a surface wave propagation.

Again today we have a large earthquake from South Pacific. The USGS listing follows: 6.2557°S, 146.4692°E, 2022-09-10 23:46:57 UTC, 90.013 km deep, mww7.6, Eastern New Guinea Reg., P.N.G. Due to propagation delays, we see the signal early on the next day (2022-09-11). Please note that the USGS predictor puts the first component (P) earlier at 2:29 and 2:53 respectively in Gatineau and Dear Lake, but all three seismograms show the first blip a little later at around 7 minute past the hour.

This signal is from far away. Our nearby reference stations did not capture anything! However we observe a ten-minute long surface component, sixty minutes after the event. The official listing follows: Event Time: 2022-08-06 15:25:09 UTC, 18.0966° S, 168.316° E, Depth: 10.0 km, Magnitude: mb5.0.
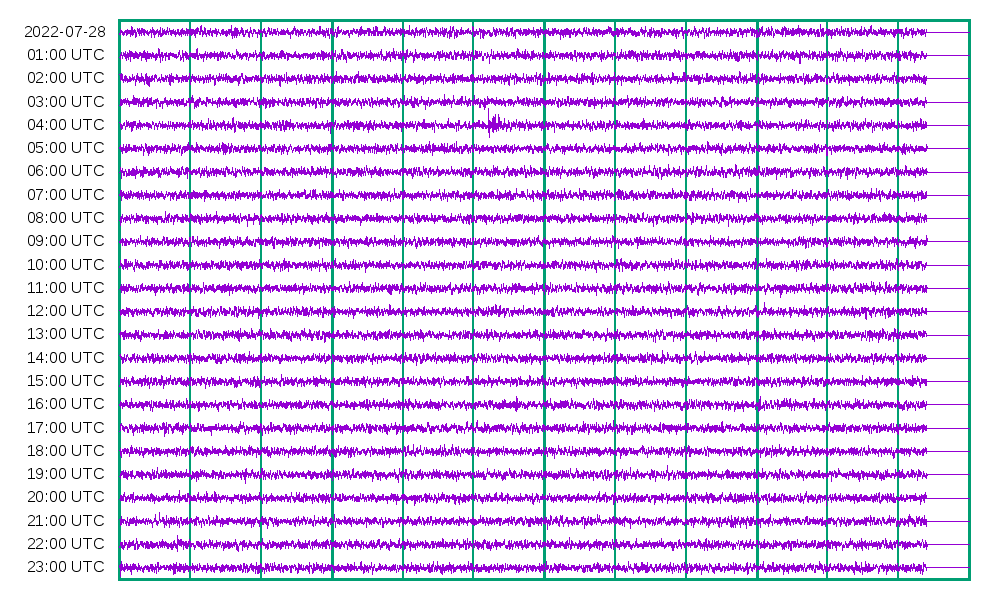
We observed a sharp P signal. The official coordinates for this seism are: 21.9507° S, 70.376° W, 2022-07-28 04:15:04 UTC, 44.74 km deep.
Today I passed the examination for the Amateur Radio Operator Certificate. I have the call sign: VE2KLW

No surface wave is visible in our location. Possibly the two visible spikes are P and S waves. The complete coordinates are: 2.0402° S,79.8105° W, 2022-07-14 22:30:12 UTC, 73.0 km, mww5.7.

This weak earthquake is not listed (yet) in the usual database, however is it mentionned on the rncan website. They say: 416 km NE of Kangiqsualujjuaq, QC, 5.12 Mw, 2022-07-12 16h58m06 UTC, 61.05° N, 60.13° W, 8 km deep. We observed a 3 minute long surface wave approaching 8 minutes later. Alas, the bulk wave is not visible.
Then one hour later a big one from the south pacific. It is listed at: Mww 6.8, 2022-07-12, 19:17:00 UTC, 22.5595° S, 114.1582° W, 10.0 km deep.

This one is listed at 14.8628° S, 70.3081° W, 2022-05-26 12:02:20 UTC. We clearly see the sharp P component at 10 minutes delay, then the PP component at 12 minutes delay.
Also, please note a five-minute long surface wave at 16:45 from South Pacific. This one "Mwb6.4 Southeast Of Loyalty Islands" is located at 22.8048° S, 172.0689° E, 2022-05-26 15:37:58 UTC. The travel time was more than one hour. Outstanding!
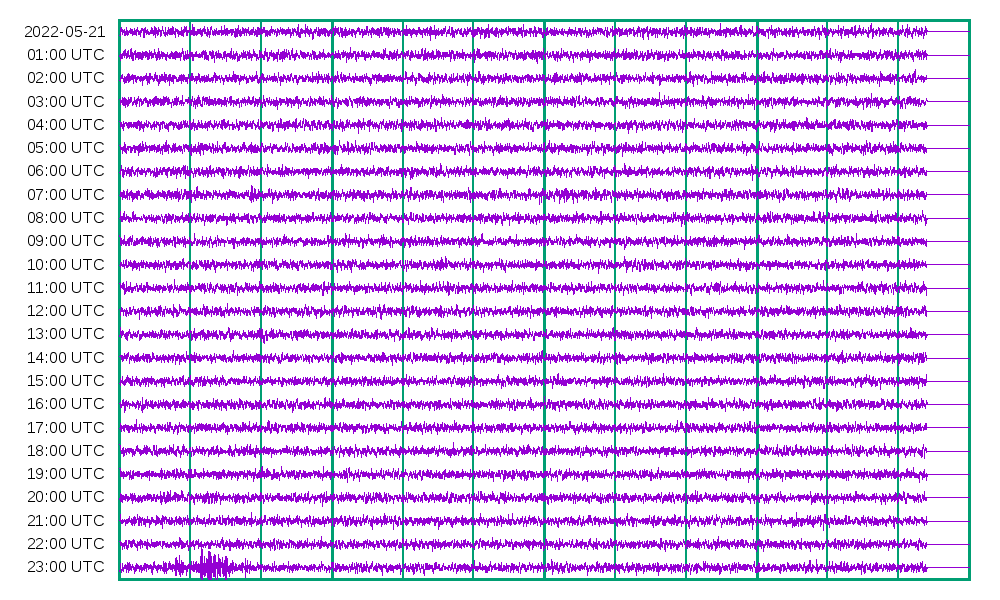
This one is listed at 13.9517° N, 120.6771° E, 2022-05-21 21:50:48 UTC. One explanation for the over one hour delay is that we observe the surface wave component.

This M6.9 earthquake is located almost in Antarctic. Its exact location and time are 54.1373° S, 159.0844° E , 2022-05-19 10:13:31 UTC. The travel time of the only visible wave component to our station was around 20 minutes.

This mww6.7 earthquake from Nicaragua has a very large amplitude for the surface wave component. This is probably because of the short distance to our station and also most of the propagation path is on the continent. The tabulated date for that event is 2022-04-21 07:42:46 UTC, and its position was 11.5538° N, 86.9919° W.

On March 11th 2011, a mega-sized M-9 earthquake located off the coast, north east of Tokyo, created a forty-meter-high tsunami wave that killed almost twenty thousand people, and partially destroyed the Fukushima nuclear power plant.[Wikipedia,"2011 ..."].
Ten years later, February 13th 2021, an M-7 earthquake - that we observed [AM, "2021 day 44"] - killed one person, injured almost two hundred, but left the power plant intact. This second earthquake has been considered an aftershock of the 2011 one (Wikipedia, "2021 ...").
Now, March 16th 2022, from the same location, almost at the same date, one more M-7 disaster (Wikipedia, "2022 ...").
Please note the seismograms from the two M-7 events are similar.
We now use a slightly modified version of the acquisition software. Previously, a new program instance was scheduled to start at the beginning of the hour. It would log data for a period of 58 minutes and then terminate just in time before it is automatically restarted by the operation system at the top of the next hour. Although it had been easy to implement, this "cold start" method caused intermitent syncronisation failures due to the asynchronous action of reloading/restarting the communication drivers. Now it has been replaced by a continuous process that can accept start/stop commands while still running. Let's hope this modification will improve the continuity of the seismograph data.
[Update:] One month later, the signal blackouts are gone for good. The acquisition process is running continuously in the background. Restarting everything at the hour was obviously a bad idea. However, We still have to pause for three minutes and restart at the top of the hour, but for a different reason. The seismometer has a second output, a DC coupled signal that comes from the integrator. This output is also sometimes referred as the (virtual) "mass position" output, ie. where the mass would be if it were free to float. This signal is highly unstable and its only use is to monitor the instrument drift. We need to monitor this output but unfortunately we do not have a second digitizer. Therefore for two minutes at the end of the hour, we pause the normal acquisition and we measure this integrator output. When the signal goes out of limits, then we must reset the mass position. Also we maintained some dead time for properly flushing the buffers etc.
This one is weak but sharp. the exact location,time and depth was: 20.8° S, 175.4° W, 05:12:33 UTC, 10.0 km.

This paragraph is not related to earthquakes. During the last months, I restored an old short wave receiver, and put an antenna on the roof. I also watched a lot of tubetube videos related to EM fields propagation and radio. I became very intrigued after I watched the video:
"Work the World with WSJT-X - Dr. Joe Taylor".
Briefly, there are a bunch of amateur radio stations that transmit a BEACON signals, in order to study the ionospheric propagation conditions. These signals are transmitted at VERY LOW POWER and are mostly inaudible to other users.
What they did, they set up a network of thousand of transmit/receive users that all report their messages through the internet. This provides a bench for further studies related to spread spectrum modulation techniques, and EM propagation. So, I decided to try that.
The messages are ONE-WAY only, and they last two minutes. They only contain the minimal/necessary data. You can be either a sender or a receiver (no license required). Once decoded, the message is transmitted to the "WSPRnet" site. Fun!
All I had to do is install the software! As it is often the case, this was an adventure, but in the end, everything works well. Almost! My receiver is old and does not switch band automatically.
You can see the log file that I recorded during one day here . I do not give a long explanation of the fields: the date, time (UTC), call sigh of the transmitter, signal to noise ratio (note the negative sign!), location (grid) etc...
I should also mention that those messages were (automatically) reported to the site WSPRnet.org, where I have the user name "SWLAM". [Update 2022-07-20: Now VE2KLW]
[Update:] I sometimes monitor WSPR messages. The list of files can be found here
[Update 2:] I am now more experienced with some digital modes. They come in two groups: The WSJTX software allowed me to receive the narrow bandwidth WSPR and FT-8 messages, while fldigi decodes the more traditional RTTY, BPSK-31, and MFSK-16 and also (partially) morse code. There are many more possibilities of course, but those mentioned here, I have effectively decoded.


At 4:14:45 UTC on the 15th there was an underwater volcanic eruption near the coast ot Tonga that created a tsunami that propagated across the ocean all the way to the coast of Califiornia and Canada. During the day the media were broadcasting warnings and the beaches were evacuated. The reports mentionned a one meter tsunami wave.
The seismograph show a corresponding wider plot which is real, since it appears on the official seismograms for GAC and DRLN stations.


On the coldest day we had for a long time, we recorded three earthquakes, the first signals of the year 2022. The figure show thke tenmperature that was recorded on the 10th and 11th. It shows the temperature went as low as -25 degrees. Strangely, it was bright with no snow.
The seismogram is filled with signals! The first one came from an earthquake not too far from Cyprus (location: KM55XC, event time: 01:07:47 UTC, distance: 8450 km ).
It was the first time we captured a signal from this region. Usually most signals come from the Pacific area plus one or two from the south.
Then at the eleventh hour, we have two earthquakes, one after the other. These two were from Alaska at AO63 a distance of 6740 km from our station.
The sharp P component is from the second 11:35:46 UTC event. It is listed as a magnitude Mww6.8 earthquake. The surface wave continues on the 12 hour line. Il looks like it is almost fourty minutes long as it blends into the third earthquake.
This earthquake comes from the same area, one hour later and seems to repeat itself almost exactly! The P component at 12:54 UTC is apparently from the 12:39:31 UTC magnitde M6.6 earthquake. Finally on the 14 hour line we see the following surface wave. Outstanding!

The four spectrograms correspond to the 1, 11, 12 and 13th seismograms respectively. The first one shows the Cyprus earthquke.


Please note the sharp (black dot) spike at (0.26 Hz, 1:20 UTC), and the broad 0.5 to 0.6 Hz signal at the same time. Unfortunately it is not possible to identify the surface wave for this earthquake.
The last three spectrograms show the two Alaska earthquakes whitin an interval of three hours. The long 0.05 to 0.07 Hz surface wave is very clear.