
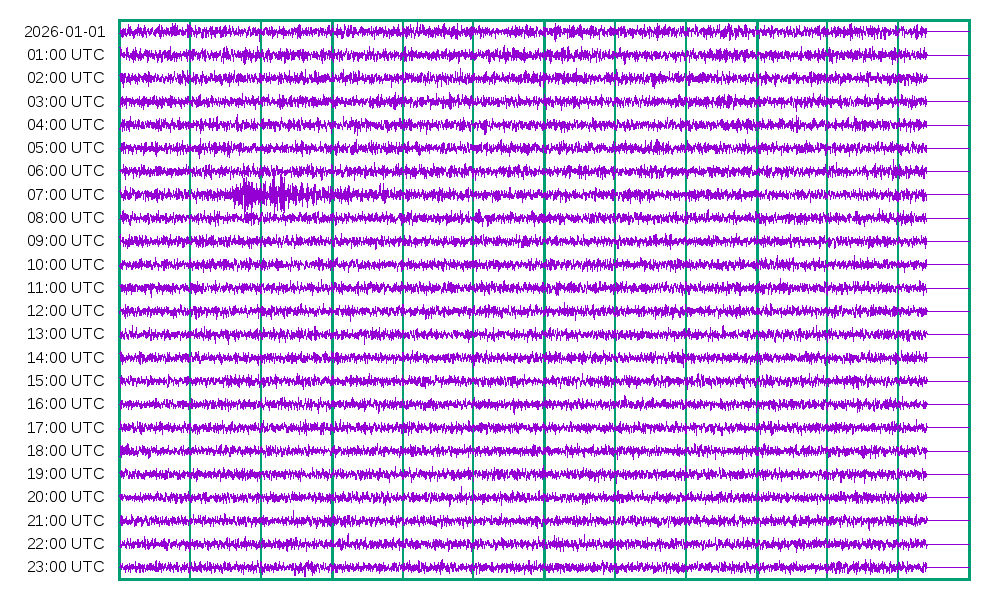
This page does NOT refresh itself, use your reload button (shift + "reload" on my computer).
This is the recent raw output of my amateur seismology station (location: FN46IS). Please see the Seismology section for a list of earthquakes detected earlier. Please note the date is indicated on the top left of the graph and the time is the universal time UTC.
 I am located in Quebec city, Canada. (FN46IS) Recently I built a
seismometer, which I operate in the basement of my house.
It took 22 months to design and build the instrument. Not a
geologist, I had to read documents and make many choices for my
first design. The instrument is in continuous operation since
February 2021. It has captured some vibrations from
distant earthquakes as well as one "local" event (M3.7). See
below the seismograms for some events that I could identify using Wilber 3
(EarthScope consortium), or
USGS Latest Earthquakes tool.
(I make sure that the seismograms are reasonably well identified otherwise I do not publish the data)
I am located in Quebec city, Canada. (FN46IS) Recently I built a
seismometer, which I operate in the basement of my house.
It took 22 months to design and build the instrument. Not a
geologist, I had to read documents and make many choices for my
first design. The instrument is in continuous operation since
February 2021. It has captured some vibrations from
distant earthquakes as well as one "local" event (M3.7). See
below the seismograms for some events that I could identify using Wilber 3
(EarthScope consortium), or
USGS Latest Earthquakes tool.
(I make sure that the seismograms are reasonably well identified otherwise I do not publish the data)

I maintain a Geiger counter in continuous operation. Its output is
periodically reported to the radmon.org
surveillance network. Here you can see the background radiation level
for three hundred stations similar to mine
on the map. My station is labelled amichaud in the list. However you can
go directly to my (semihourly) report on their site by
following the link here.
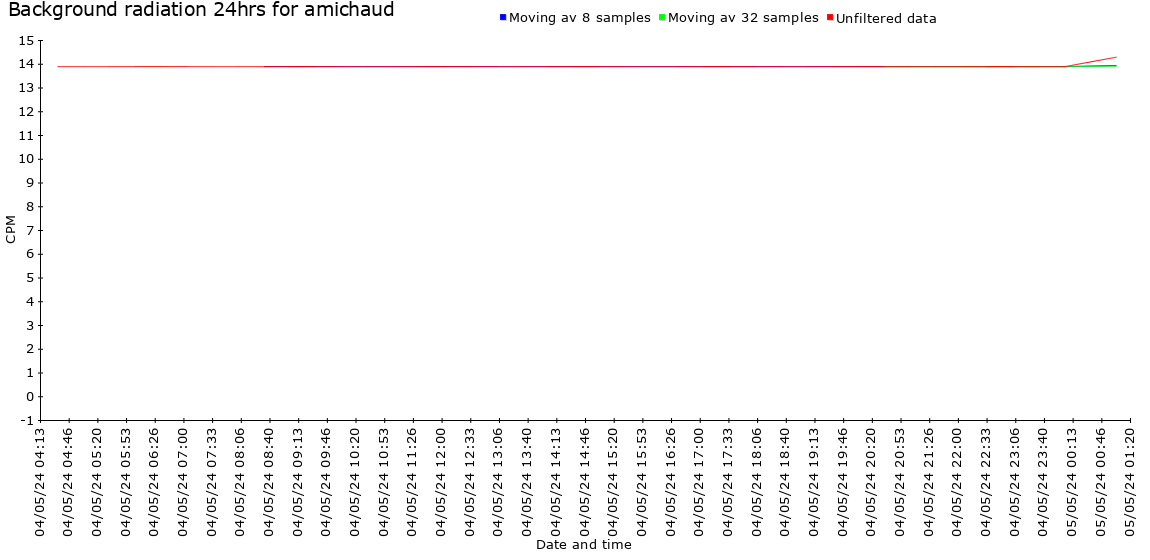
A Count rate below 20 CPM (counts per minute) is normal for my station.
The instrument is installed against the roof in the attic which makes it sensitive to radioactivity from rainfall.
Remark: Unlike other stations in the
radmon.org network,
the numbers that are uploaded
from my station represent the number of counts per minute (CPM)
that has already been averaged over a period of thirty minutes.
To conserve network bandwidth and obtain statistically more meaningfull numbers, I restrict the data flow to one transmission every hour.
I think this is the reason why some plots have a
different aspect for my station.
Again: the numbers that I upload are 30 minutes averages
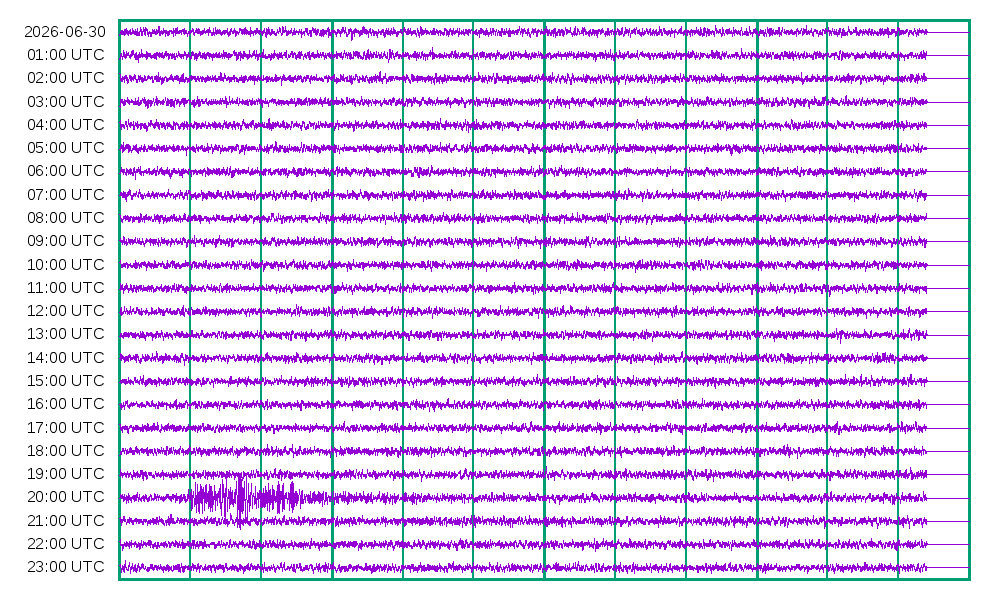
COORD: 24.8239 °N, 108.9285 °W, 2026-06-30 19:45:40 UTC, 10.0 km, mww6.0 Gulf Of California.
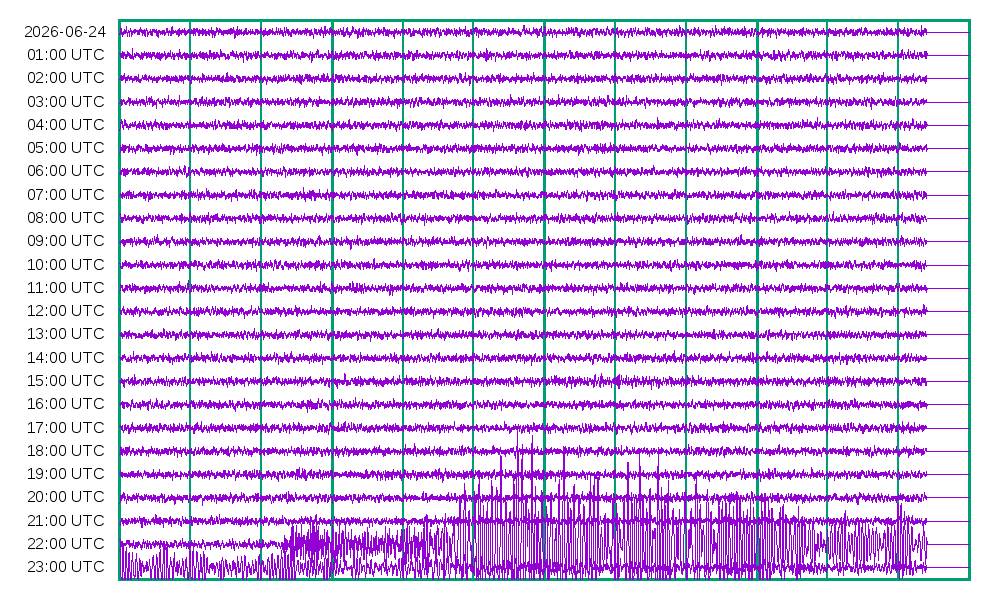
COORD: 10.453 °N, 68.5139 °W, 2026-06-24 22:05:12 UTC, 10.0 km, mww7.5 Near Coast Of Venezuela. There were 2300 person who died in this tragedy.
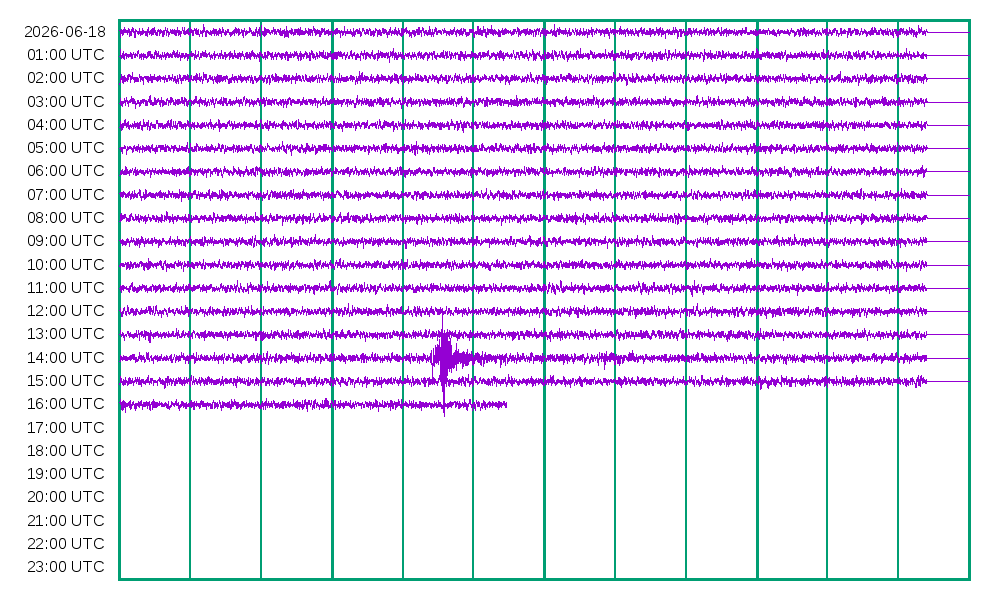
COORD: 48.7895 °N, 68.0193 °W, 2026-06-18 14:21:21 UTC, 10.0 km, mwr4.4 Gaspe Peninsula, Canada.
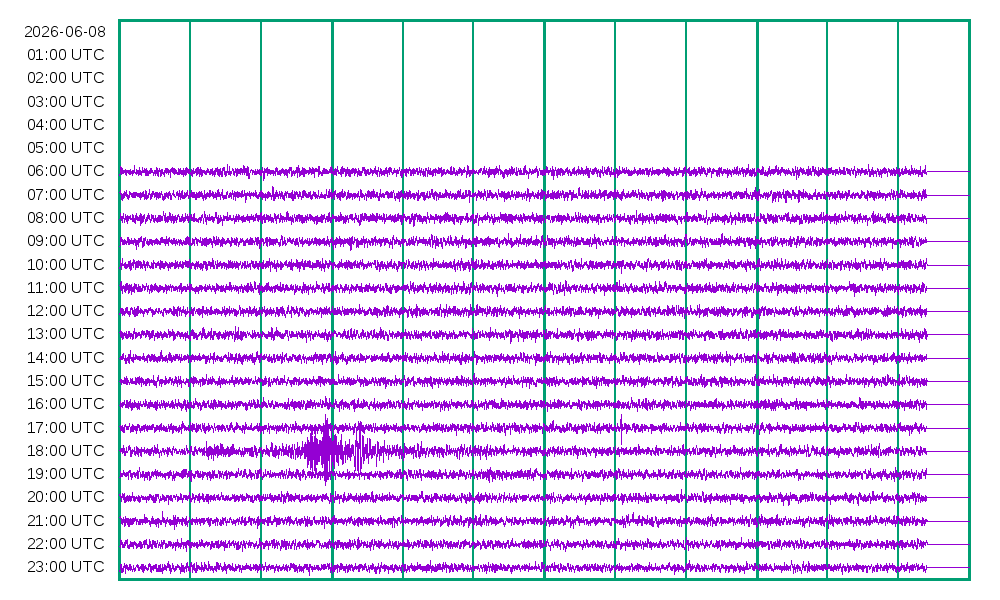
COORD: 22.7854 °N, 85.1501 °W, 2026-06-08 18:00:27 UTC, 26.0 km, mww6.1 Cuba Region.
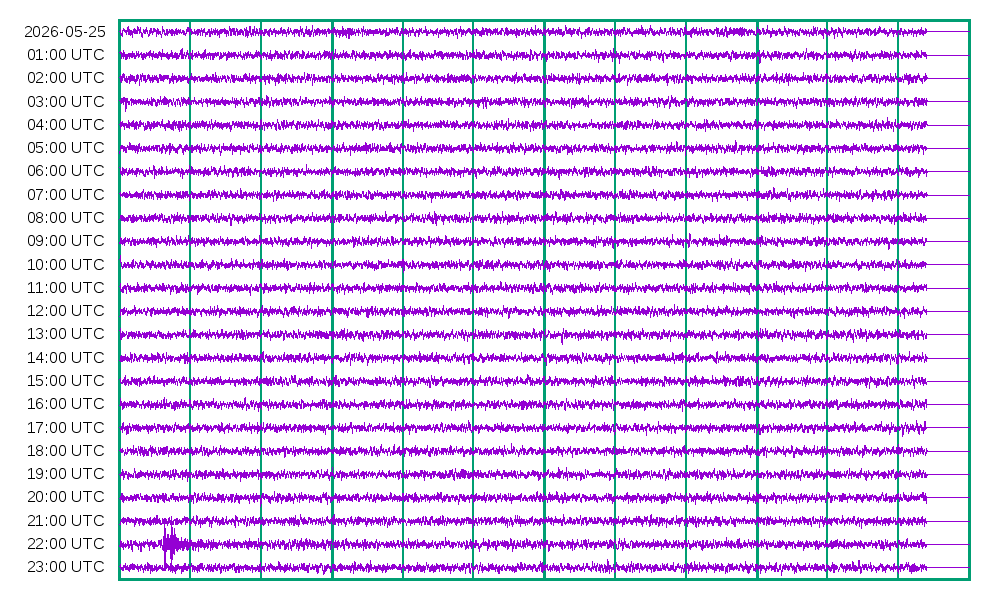
COORD: 22.3883 °S, 68.6422 °W, 2026-05-25 21:52:20 UTC, 109.0 km, mww6.9, Northern Chile.
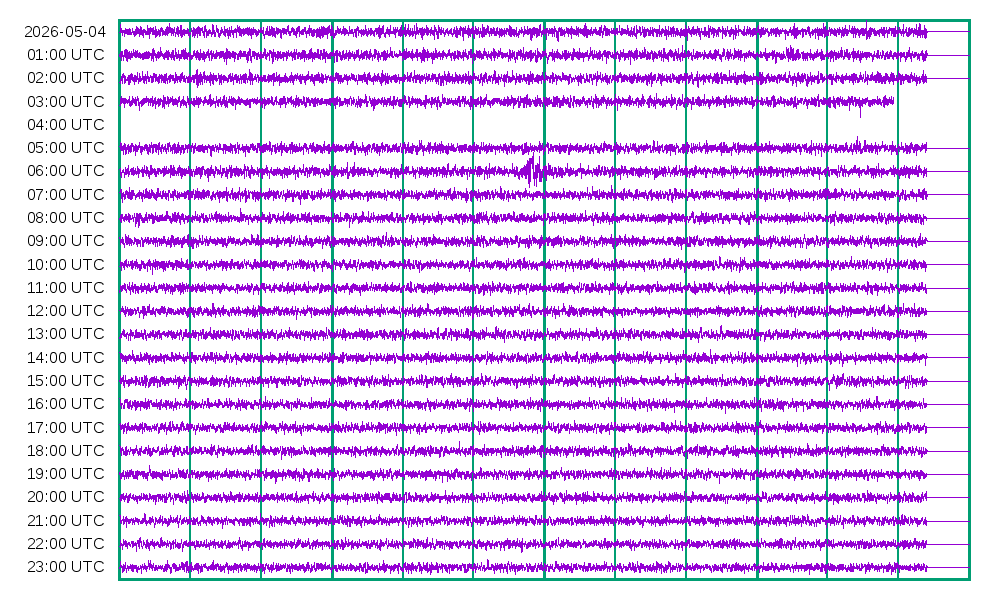
COORD: 11.7774 °N, 125.3718 °E, 2026-05-04 06:09:50 UTC, 73.268 km, mww6.0, Samar, Philippines.
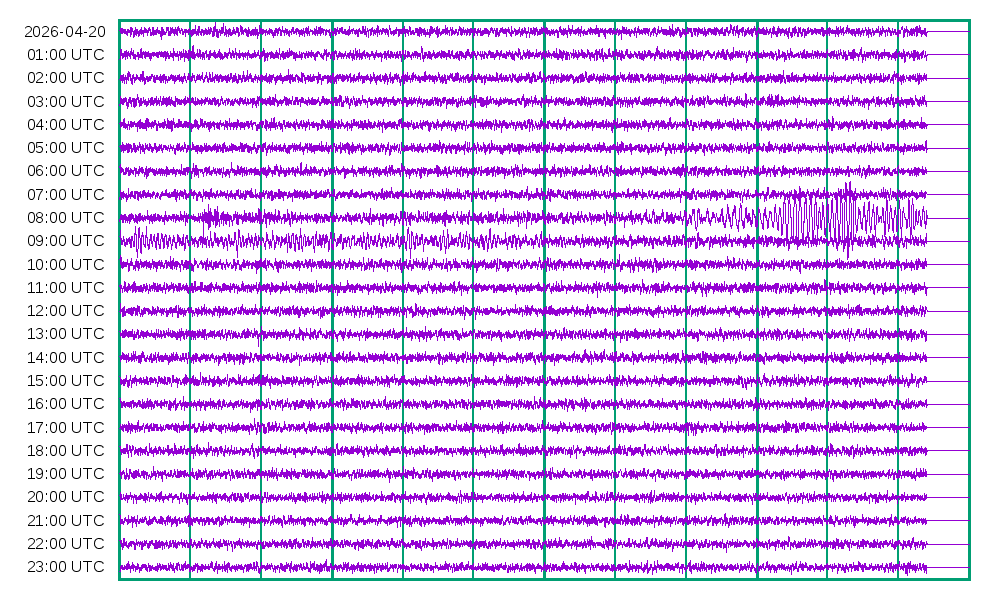
COORD: 39.9532 °N, 143.0462 °E, 2026-04-20 07:53:00 UTC, 35.0 km, mww7.4 Off East Coast Of Honshu, Japan.
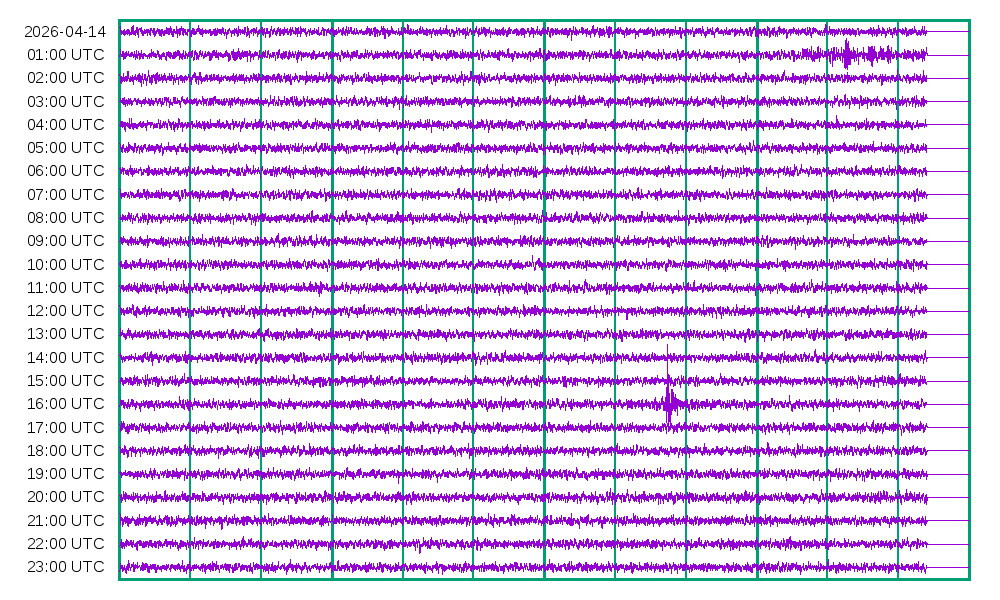
COORD: 45.7682 °N 76.3966 °W 2026-04-14 16:36:42 UTC, 10.0 km, mwr4.0 Southern Ontario, Canada.
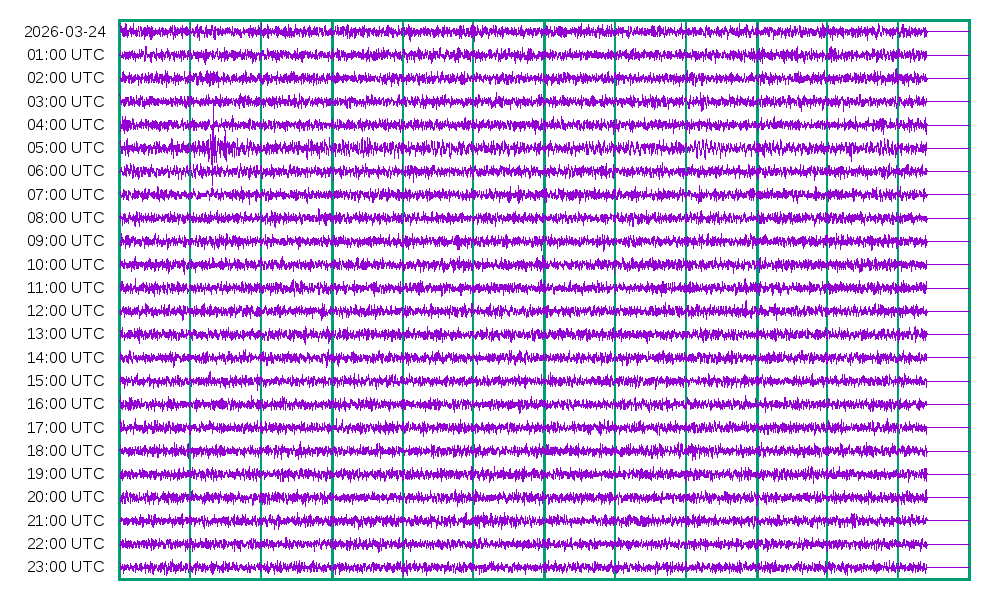
COORD: 18.6678 °S, 175.5601 °W, 2026-03-24 04:37:50 UTC, 229.453 km, mww7.5 Tonga Islands.
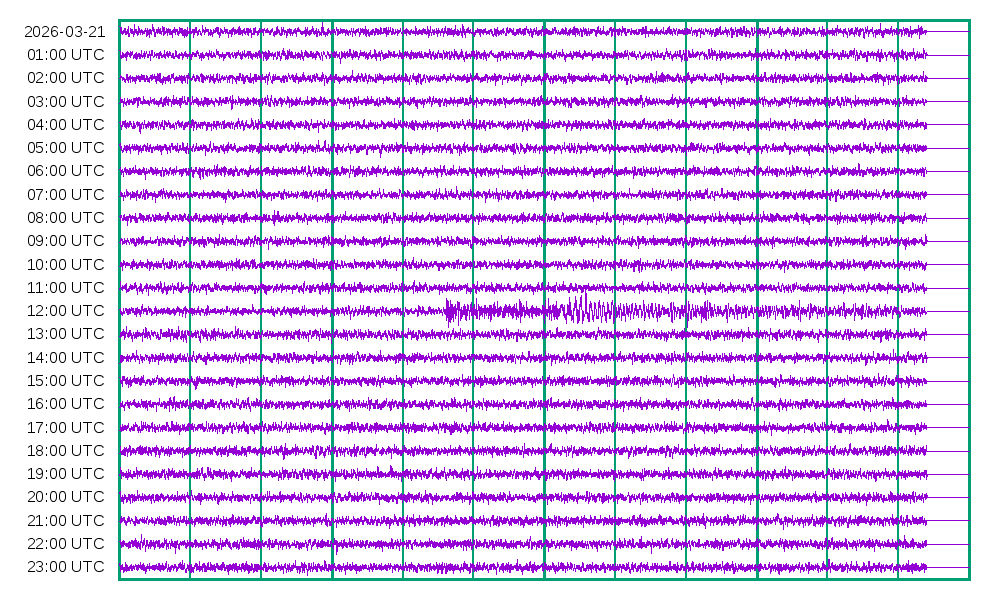
COORD: 23.8496 °N 45.8331 °W 2026-03-21 12:16:46 UTC, 10.0 km, mww6.6 Northern Mid-Atlantic Ridge.
On March 11th 2011, a mega-sized M-9 earthquake located off the coast, north east of Tokyo, created a forty-meter-high tsunami wave that killed almost twenty thousand people, and partially destroyed the Fukushima nuclear power plant.[Wikipedia,"2011 ..."].
Ten years later, February 13th 2021, an M-7 earthquake - that we observed [AM, "2021 day 44"] - killed one person, injured almost two hundred, but left the power plant intact. This second earthquake has been considered an aftershock of the 2011 one (Wikipedia, "2021 ...").
Then, March 16th 2022, from the same location, almost at the same date, one more M-7 disaster (Wikipedia, "2022 ...").

COORD: 52.2664 °N, 176.3634 °E, 2026-03-04 17:54:36 UTC, 10.0 km, Mww6.4, Rat Islands, Aleutian Islands.
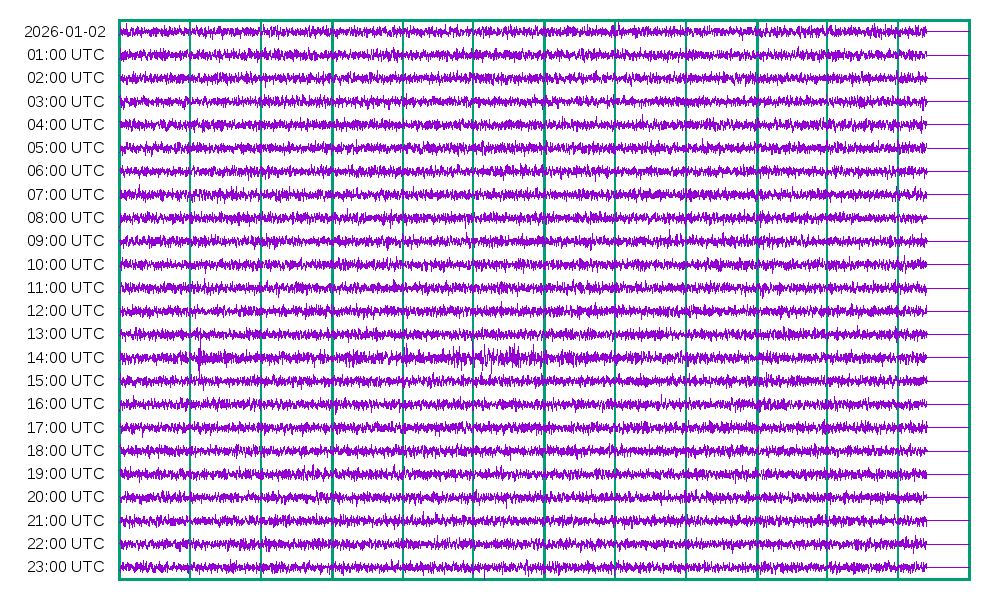
COORD: 16.9017 °N, 99.3026 °W, 2026-01-02 13:58:18 UTC, 35.0 km, mww6.5 Near Coast Of Guerrero, Mexico.
COORD: 60.4759 °N, 140.1243 °W, 2026-01-01 06:46:55 UTC, 9.03 km, mww5.7 Southeastern Alaska.
 |
 |
This is the completed force balance seismometer AM1.
It was put in continuous operation in
january 2021. A short description is available here.
The bandwidth of this instrument is below 1 Hertz (2 samples per second)
downto appproximately one over 10 seconds, possibly less.
It is located in the corner of the basement in the subburb of Quebec city.
Thanks to this low 1 Hz low-pass frequency the street trafic noise does not
show on the seismograms. Our measurement goal was low-frequency
long-distance earthquakes that that can be identified
against public databases.
Although it is not evacuated, the instrument is in a barometric enclosure.
The electronic feedback system and digitizer are located inside
this enclosure so the vacuum operation would be difficult to attain.
The power supply, the USB data bus and the one-wire command bus go
into the enclosure thru a single 5-pin hermetic connector.
(A most troubling effect is that we observe an increase of "seismic" noise
during raining days.)
As usual, there is also a thermal blanket outside the enclosure.
The boom and spring are built with mostly non-magnetic materials.
There is no magnetic shield (due to cost).
The next prototype should have a proper calibration
curve but at this moment AM1 does not have it. After two years
of development,
it was convenient to put it in operation and have fun
observing seismograms! This problem is universal to the whole of
Metrology science:
if you spend all your time studing your instrument then you can't
use it to measure.
| This page is a personal web page
related to SEISMOLOGY as a HOBBY. This means
that this page has not been peer reviewed, as well
as it is not endorsed by any public or commercial
organization. I am a retired electrical engineer, and my skills are related to building and using high precision measuring instruments, building atomic clocks, and tunable lasers. I also participated to fundamental research in laser spectroscopy, a physics science called "laser cooling and trapping", and also production of "Bose-Enstein Condensation". I also designed and built "Atomic Clocks". These are high performance time-keepers. I built many prototypes. Finally I was responsable for a Microwave Metrology Laboratory. I published my research in scientific journals. But this page is not about that! As I just explained, I am only an amateur in this field! If you are uncertain, please do not use the information presented on this page. On the other hand, I should mention that I do not receive any amount of money and I do not comment on any organization, any other result or any comercial product. If you find any indication of the opposite please accept my apology and let me know so I can quickly correct my mistake. My objective is show that it is possible to build real, functional measuring instruments using modest resources, while having fun! |